iShares iBoxx $ High Yield Corporate Bond ETF (HYG) is the largest U,S. corporate high yield bond exchange traded fund (ETF) with total assets exceeding $13 million at the time this article was written.
Below is a chart showing HYG's daily closing price since near its inception date in mid-2007. Of note are two apparent long-term support/resistance lines:
- Resistance line "A" (red) that has been in play since the start of the market crash in late 2008 (start of crash is labeled "1" on the chart).
- Support line "B" (dark blue) that has been in play since early 2009. This line also acted as both temporary support and resistance during HYG's repeated whipsaw action in late 2008 - early 2009 time frame.
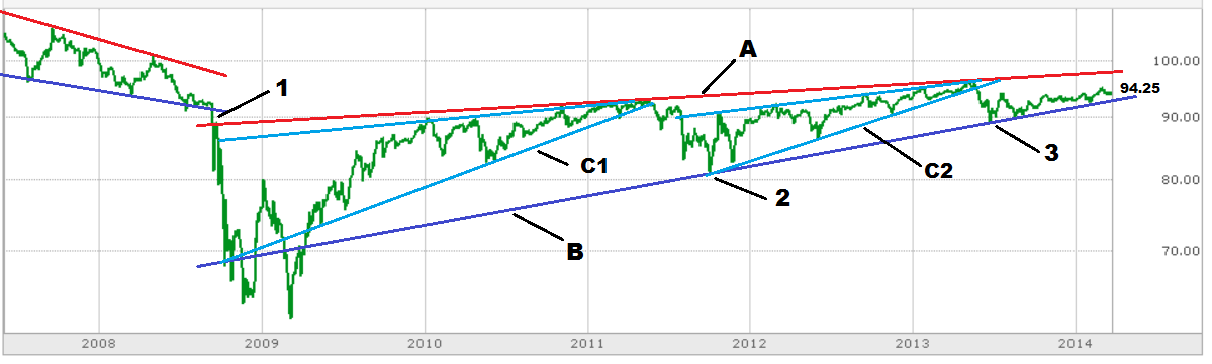 |
| HYG: daily closing prices since mid-2007 | semi-log chart (click to enlarge) |
Within this long-term rising wedge pattern are two intermediate-term rising wedges "C1" and "C2" (support and resistance delineated by light blue lines). Both of these wedges terminated when the price hit long-term resistance line "A" and support for each wedge was broken. Both support breaks led to significant corrections with price declines down to long-term support line "B", at points labeled "2" and "3" on the chart.
Since the last test of long-term support at "3" in June 2013, HYG's price action has been relatively subdued, and it has tested long-term support a few more times while its price continues to increase.
As shown in more detail below on the 1-year, daily chart, since mid-September 2013, HYG appears to be trading within a rising channel defined by the red and blue lines.
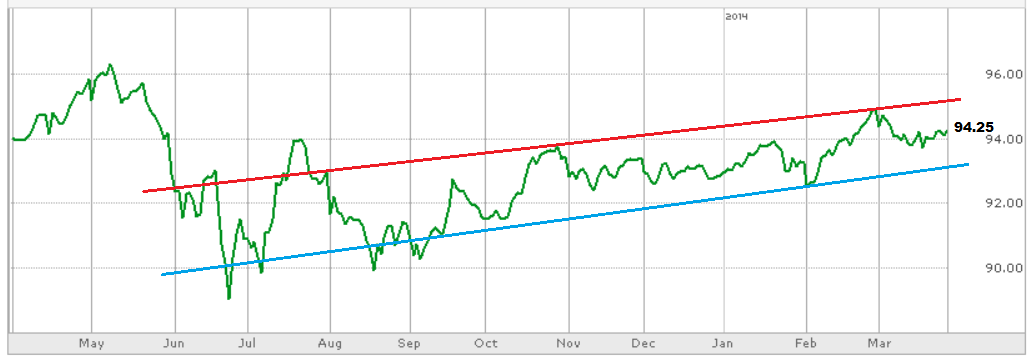 |
| HYG: 1-year | daily | semi-log chart (click to enlarge) |
Not Investment Advice | Important Disclaimer:
The content in this article, including the identification and discussion of any specific security (e.g., bond fund), is NOT meant to be and should NOT be construed and/or used as investment advice. This article is for general information and educational purposes only. Please read the Disclaimers for junkbondrecycling.com in their entirety. The U.S. Securities and Exchange Commission website has guidance on selecting an investment adviser.
Financial Disclosure:
The author/publisher does not hold own any shares of HYG, but does own positions in corporate high yield bond mutual funds.
Financial Disclosure:
The author/publisher does not hold own any shares of HYG, but does own positions in corporate high yield bond mutual funds.
No comments:
Post a Comment