The 5-year weekly and 3-year daily charts below show that NHINX rallied off long-term support (dark blue lines) in early February 2014 and then proceeded to break through two long-term lines of resistance (light blue and orange lines) before meeting the shorter-term falling resistance line (red) at the end of February (last week).
This week NHINX declined slightly to the former resistance lines shown in the 3-year (light blue, orange) and 1-year (dark blue) daily charts.
(click chart to enlarge)
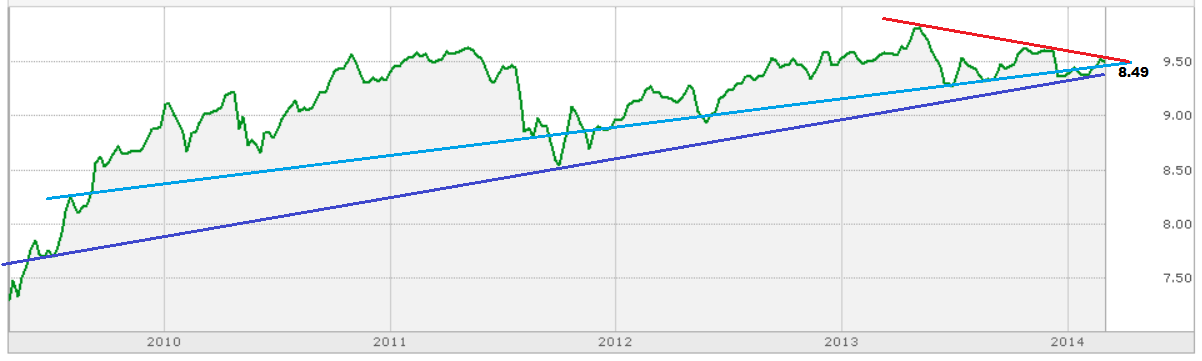 |
| NHINX chart: 5-yr | weekly | semi-log |
(click chart to enlarge)
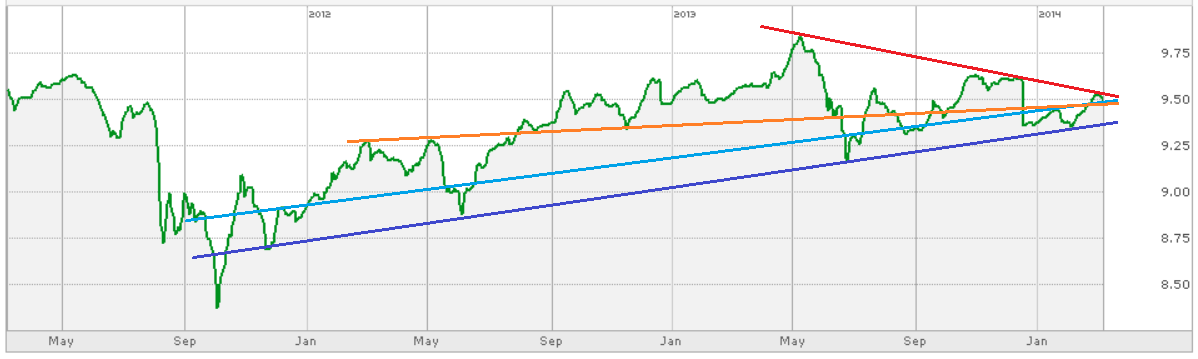 |
| NHINX: 3-yr | daily | semi-log |
(click chart to enlarge)
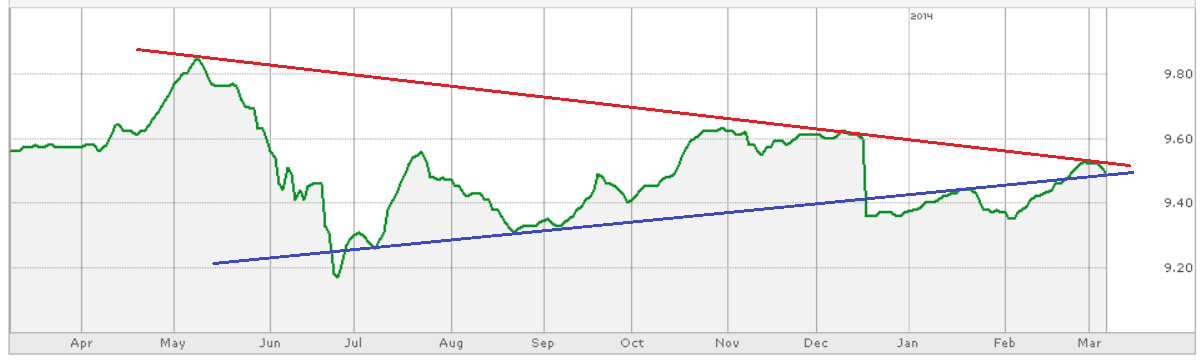 |
NHINX chart: 1-yr | daily | semi-log
|
Going forward it will be interesting to see if the former resistance lines provide support and if they do, if falling overhead resistance can be broken (red line, all graphs). We generally use NHINX as an indicator for corporate high yield bond mutual funds.
Not Investment Advice | Important Disclaimer:
The content in this article, including the identification and discussion of any specific security (e.g., bond fund), is NOT meant to be and should NOT be construed and/or used as investment advice. This article is for general information and educational purposes only. Please read the Disclaimers for junkbondrecycling.com in their entirety. The U.S. Securities and Exchange Commission website has guidance on selecting an investment adviser.
Financial Disclosure:
The author/publisher owns shares of NHINX and other corporate high yield bond mutual funds.
Financial Disclosure:
The author/publisher owns shares of NHINX and other corporate high yield bond mutual funds.
No comments:
Post a Comment