In our preceding post on August 3, 2014, it was illustrated that TGEIX had suddenly broken down through several lines of support after failing to break up through overhead resistance line R1.
In the chart below, after continuing to fall for a bit, it now appears that TGEIX has found dual support lines with associated positive price reaction at S1 and S2.
Please note that this chart has been simplified and support lines have been renamed from previous TGEIX posts (e.g., S5 in the previous post is now S2).
(Click Chart to Enlarge)
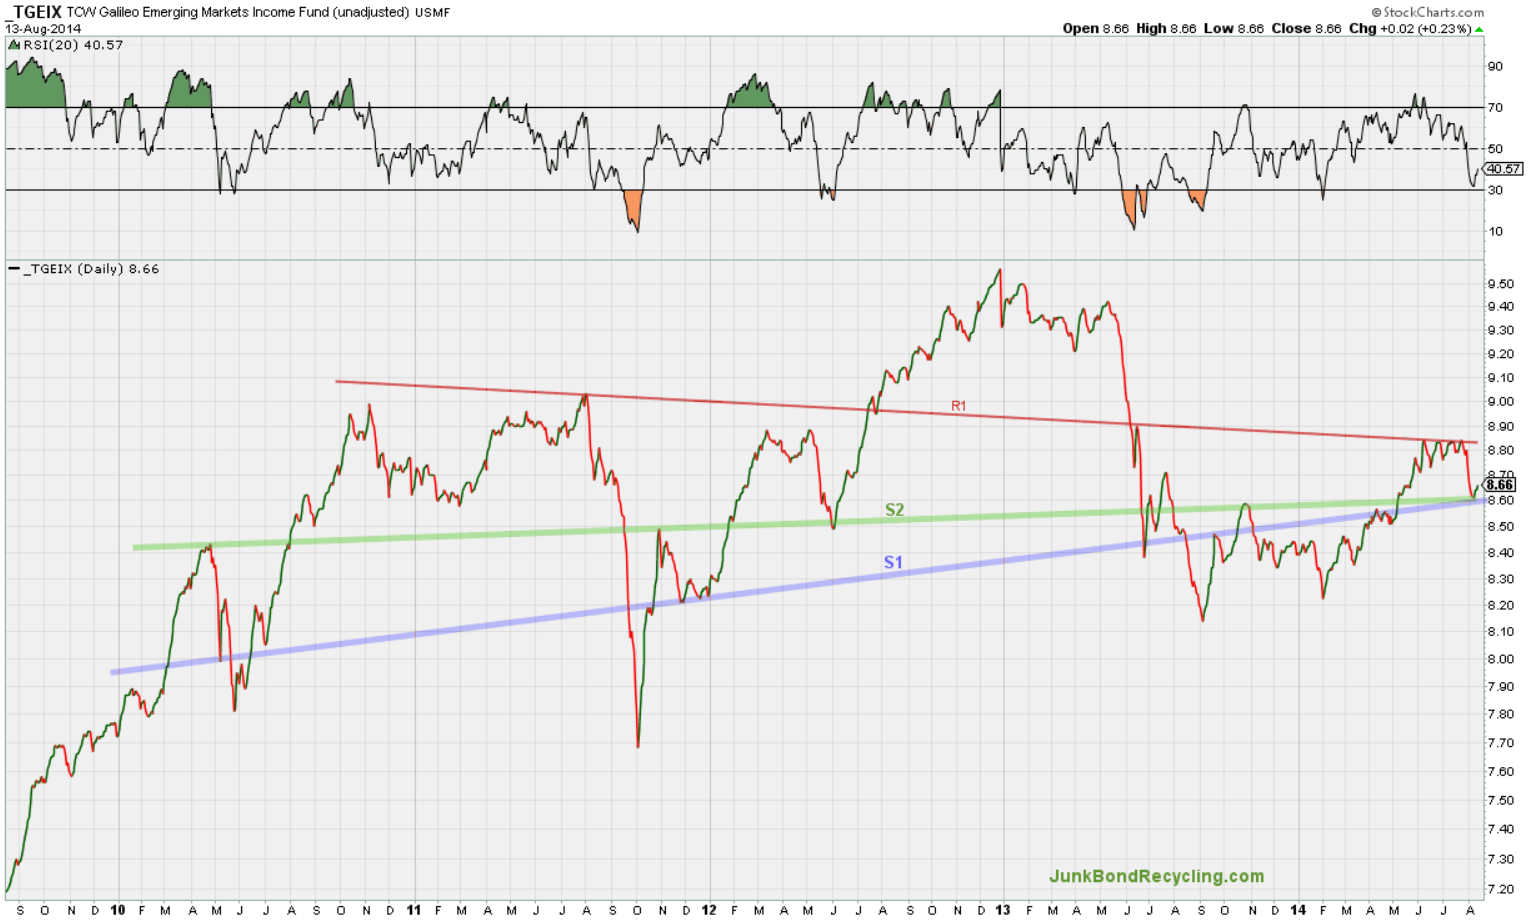 |
TGEIX Chart: 5yr | daily | semi-log | unadjusted prices |
Going forward we will be interested to see if TGEIX will remain above support lines S1 and S2 and possibly challenge resistance line R1 again.
Not Investment Advice | Important Disclaimer:
The content in this article, including the identification and discussion of any specific security (e.g., bond fund), is NOT meant to be and should NOT be construed and/or used as investment advice. This article is for general information and educational purposes only. Please read the Disclaimers for junkbondrecycling.com in their entirety. The U.S. Securities and Exchange Commission website has guidance on selecting an investment adviser.
Financial Disclosure:
The author/publisher has recently taken a position in TGEIX.
Financial Disclosure:
The author/publisher has recently taken a position in TGEIX.
Base Chart Provided Courtesy of StockCharts.com. Analysis and Annotation by JunkBond Recycling.com (all rights reserved)
No comments:
Post a Comment