 |
| click chart to enlarge |
 |
| click chart to enlarge |
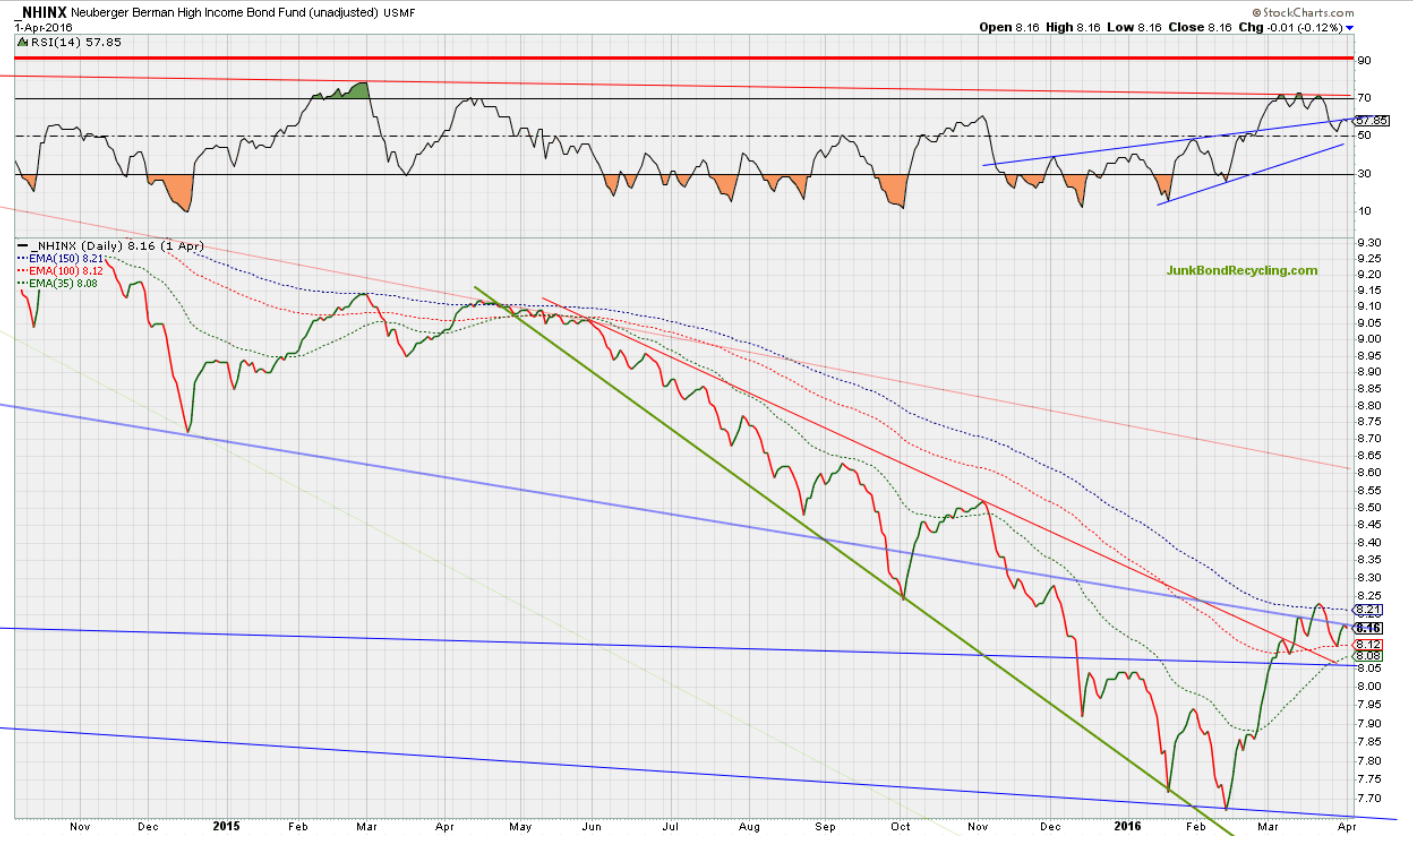
I stepped out of U.S. corporate high yield bond funds around March 23 when NHINX failed to hold the 150-day ema and failed to break above RSI resistance on the daily chart. Took some nice short-term gains.
Too soon to tell what happens from here. Failure to get above weekly resistance is also not encouraging to me along with concurrent crude oil weakness.
Please remember that this is not investment advice. You alone are responsible for your investment decisions. See disclaimers below and elsewhere on this website.
Not Investment Advice | Important Disclaimer:
Financial Disclosure:
The author/publisher has no position in U.S. corporate high yield bond funds at the time this article was written. This position may change depending on future price action.
Base Chart Provided Courtesy of StockCharts.com. Analysis and Annotation by JunkBond Recycling.com (all rights reserved)
No comments:
Post a Comment