The following 5-year daily chart shows that municipal high yield bond fund ABHYX (American Century) is testing support lines S2 and S3 after being turned back at resistance line R1 and overbought conditions per the RSI (Relative Strength Index - upper part of chart). Since the price correction down to S2 and S3, overbought conditions have been alleviated.
Going forward, we will be interested to see if support levels S2 and S3 will hold and if this fund will continue its increasing price trend that started back in October 2013. If S2 and/or S3 do not hold, ABHYX's price could possibly drop to support line S1.
(Click Chart to Enlarge)
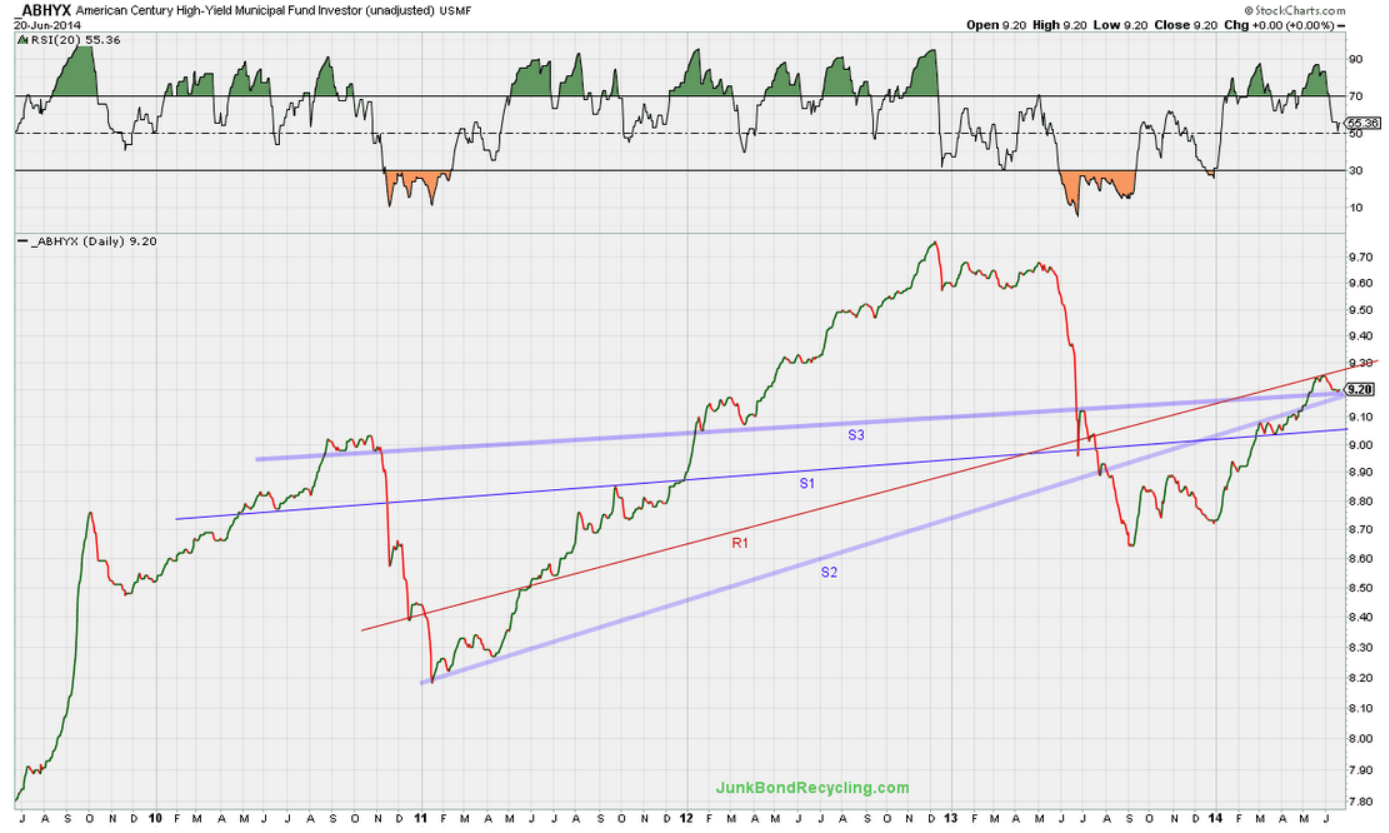 |
ABHYX Chart: 5yr | daily | Semi-log | Unadjusted Prices |
Not Investment Advice | Important Disclaimer:
The content in this article, including the identification and discussion of any specific security (e.g., bond fund), is NOT meant to be and should NOT be construed and/or used as investment advice. This article is for general information and educational purposes only. Please read the Disclaimers for junkbondrecycling.com in their entirety. The U.S. Securities and Exchange Commission website has guidance on selecting an investment adviser.
Financial Disclosure:
The author/publisher owns shares of municipal high yield bond mutual fund ABHYX.
Base Chart Provided Courtesy of StockCharts.com. Analysis and Annotation by JunkBond Recycling.com (all rights reserved)
Financial Disclosure:
The author/publisher owns shares of municipal high yield bond mutual fund ABHYX.
Base Chart Provided Courtesy of StockCharts.com. Analysis and Annotation by JunkBond Recycling.com (all rights reserved)
No comments:
Post a Comment