The following two charts show that two large total asset, no-load, corporate high yield bond funds, VWEHX (Vanguard, $17.2 Billion) and BHYSX (Blackrock, $15.1 Billion), have formed rising wedges over the last year and are currently in "overbought" conditions per the RSI (Relative Strength Index above "70" - upper section of the charts).
Together these two funds have grown by about $1.5 billion in total assets (combined total assets now = $32.3 billion) since our previous post in late April 2013.
As the charts below show, prices for both funds are at or near rising resistance line R1, which forms the top of the rising wedge, while long-term support line S1 forms the bottom of the rising wedge. In the case of VWEHX, a shorter-term support line S2 also exists, which forms another rising wedge when combined with R1.
Over the last 5 years, rising wedges, which are often reversal patterns, have led to significant corrections (starting at D1 and D2) in both of these funds when the wedges (orange lines) encountered long-term resistance line R2 and underlying support (bottom of wedge) was broken. Fund prices are not currently near R2 as shown in the charts and discussed below.
(Click Chart to Enlarge)
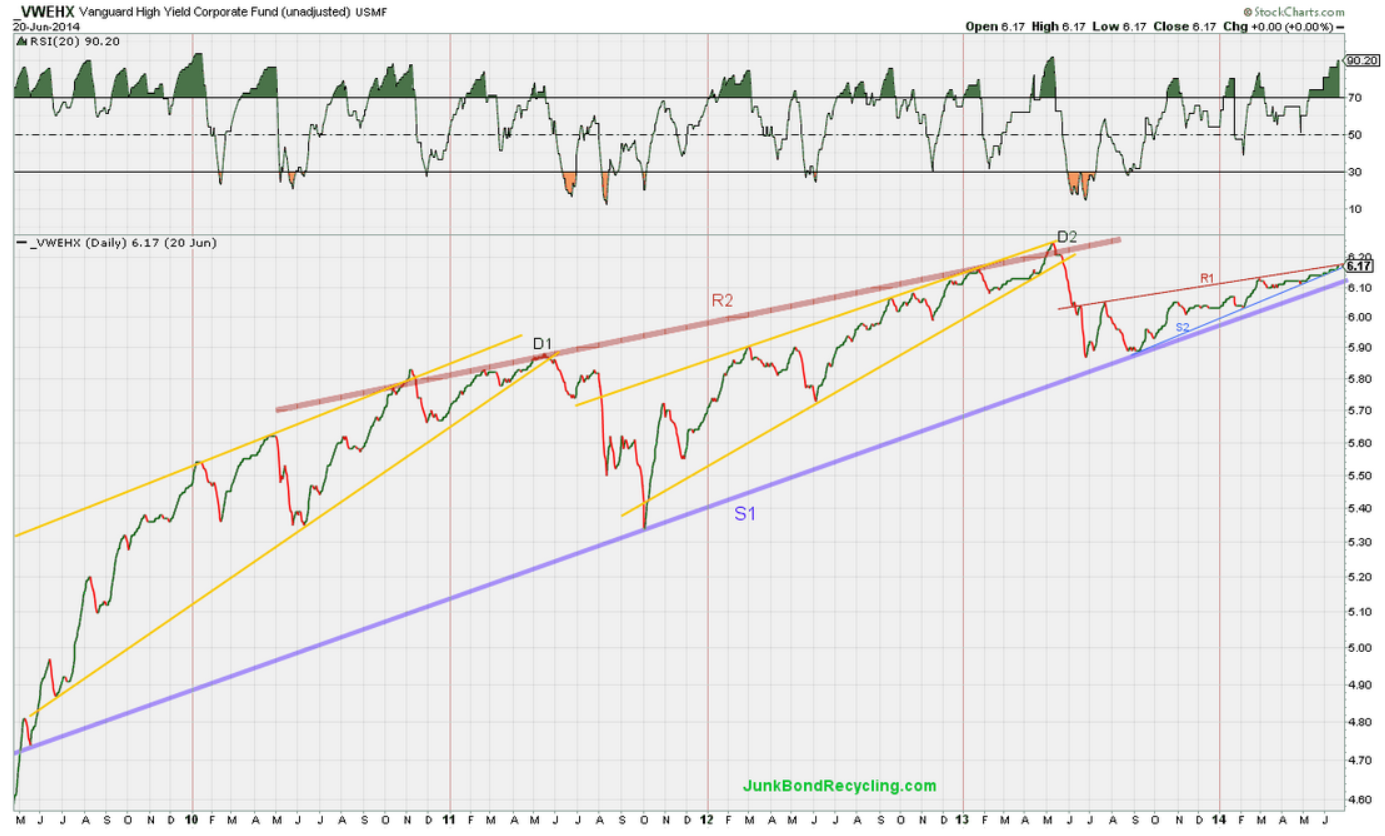 |
VWEHX Chart: 5yr | daily | semi-log | unadjusted prices |
(Click Chart to Enlarge)
 |
BHYSX Chart: 5yr | daily | semi-log | unadjusted prices |
Going forward we will be very interested to see if long-term support line S1 can be maintained in spite of the rising wedge formed in combination with R1. If S1 support is broken, the upward trend may be over and much lower prices are possible.
If S1 support can be maintained, the upward trend will remain in place. We will then be interested to see if resistance line R2 will eventually be tested again as S1 and R2 converge. Together, S1 and R2 form a much larger rising wedge that may have significant implications for fund prices in the longer-term.
If S1 support can be maintained, the upward trend will remain in place. We will then be interested to see if resistance line R2 will eventually be tested again as S1 and R2 converge. Together, S1 and R2 form a much larger rising wedge that may have significant implications for fund prices in the longer-term.
Not Investment Advice | Important Disclaimer:
The content in this article, including the identification and discussion of any specific security (e.g., bond fund), is NOT meant to be and should NOT be construed and/or used as investment advice. This article is for general information and educational purposes only. Please read the Disclaimers for junkbondrecycling.com in their entirety. The U.S. Securities and Exchange Commission website has guidance on selecting an investment adviser.
Financial Disclosure:
The author/publisher does not hold positions in either of these funds (BHYSX, VWEHX), but has positions in several other corporate high yield bond funds.
Financial Disclosure:
The author/publisher does not hold positions in either of these funds (BHYSX, VWEHX), but has positions in several other corporate high yield bond funds.
Base Chart Provided Courtesy of StockCharts.com. Analysis and Annotation by JunkBondRecycling.com (All Rights Reserved)
No comments:
Post a Comment