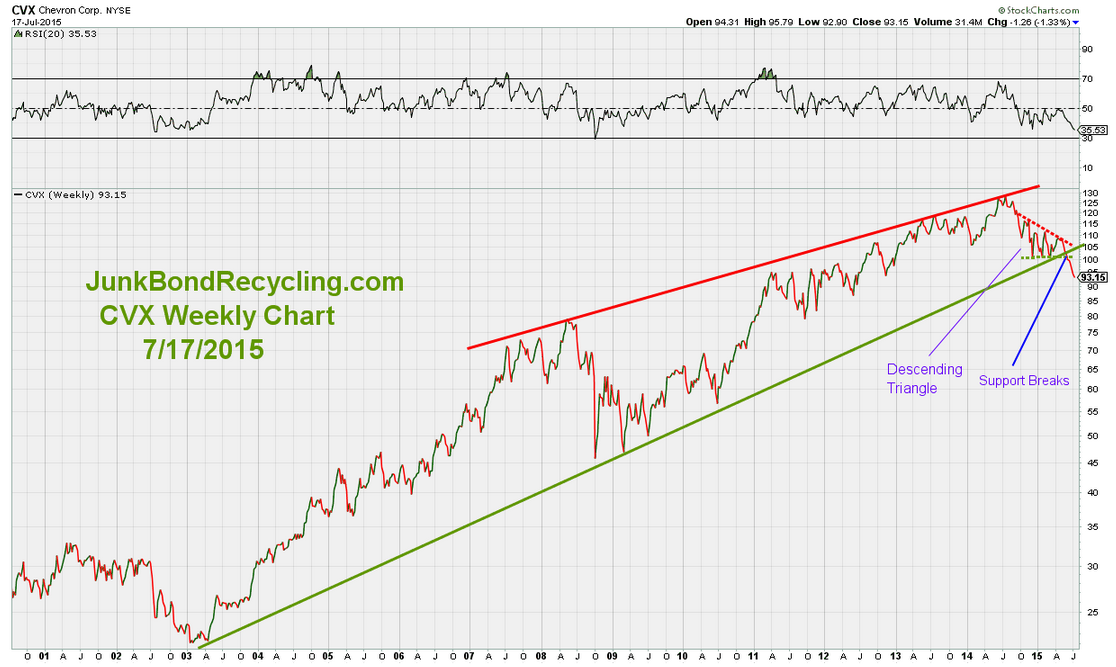
After breaking support, the price decline was relatively dramatic as it apparently triggered selling by traders.
How far will CVX fall before establishing an intermediate to long-term bottom? We don't know. But if we were interested in owning CVX, we would be watching for positive price action associated with a support line in conjunction with oversold conditions before establishing a buy and protect position/strategy.
Not Investment Advice | Important Disclaimer:
The content in this article, including the identification and discussion of any specific security (e.g., bond fund), is NOT meant to be and should NOT be
construed and/or used as investment advice. This article is for general
information and educational purposes only. Please read the Disclaimers for junkbondrecycling.com in their entirety. The U.S. Securities and Exchange Commission website has guidance on selecting an investment adviser.
Financial Disclosure:
The author/publisher has no position in oil or CVX at the time this article was written.
Financial Disclosure:
The author/publisher has no position in oil or CVX at the time this article was written.
No comments:
Post a Comment